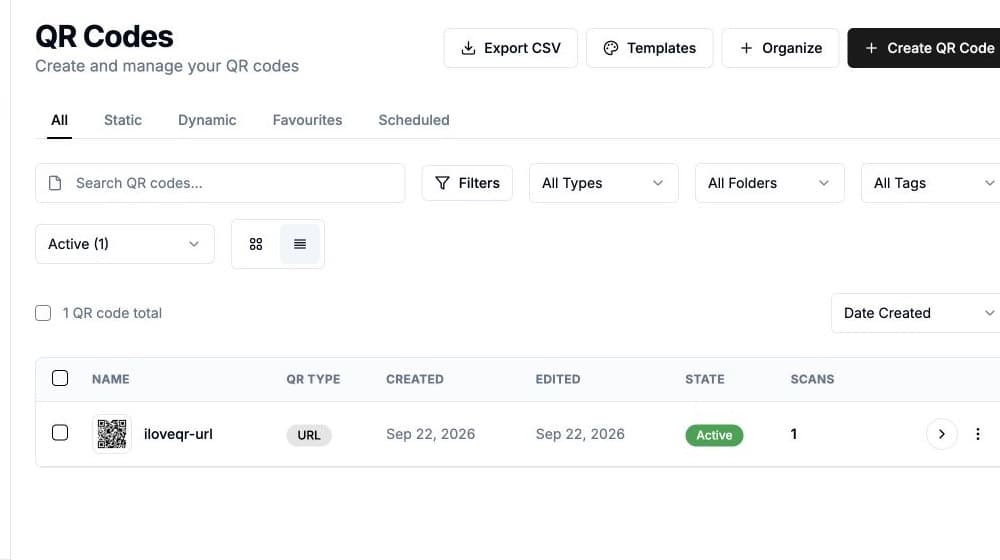
Understanding how your QR codes perform is crucial for any marketing campaign. Our analytics dashboard gives you real-time insights into scan counts, geographic distribution, device types, peak scanning times, and more. Make data-driven decisions and optimize your QR code campaigns.
Benefits
Real-time tracking
See scans as they happen with live updating dashboards.
Geographic insights
View scan locations on an interactive map, down to city level.
Device breakdown
Know if your audience uses iOS, Android, or desktop devices.
Time analysis
Discover when your QR codes get the most scans.
Unique vs total scans
Differentiate between unique visitors and repeat scans.
Export reports
Download detailed reports in CSV or PDF format.
How to use
Create a dynamic QR
Analytics are available for all dynamic QR codes.
Share your QR code
Distribute your QR code and start collecting data.
Analyze performance
View insights in your dashboard and optimize campaigns.